ENVIRONMENTAL INFORMATION
ESRS E5 Resource use and circular economy
SBM - 3: MATERIAL IMPACTS, RISKS AND OPPORTUNITIES AND THEIR INTERACTION WITH STRATEGY AND BUSINESS MODEL
| Stage* | Description | Likelihood of occurrence | Time horizon | |
| Resource inflows, including resource use | ||||
| (-) Impact | OP, Pt | Increase in the consumption of raw materials and greater generation of waste in construction. | Actual | S |
| Waste | ||||
| (+) Impact | OP, Pt | Efficient use of resources: reduction, reuse or recycling of waste in construction. | Actual | S |
| Opportunity | OP, Pt, C | New ways of developing Ferrovial Construction’s business through authorized waste management. | S | |
*OP: Own operations; VC: Value Chain; Pu: Purchases; C: Customers; Pt: Partners; S: Short term; M: Medium term; L: Long term.
E5 – 1: POLICIES RELATED TO RESOURCE USE AND CIRCULAR ECONOMY
| Policy | Quality & Environmental policy |
|---|---|
| Description | Ferrovial, through its Quality and Environment Policy, applies eco-efficiency principles in the Company’s activities through the efficient use of resources and the reduction, reuse or recycling of waste. It also seeks to reduce waste generated by its activities, while exploring new business development opportunities in the field of waste management, promoting continuous improvement and transparency. The circular economy principles are also included in the Quality and Environment Policy, which establishes the efficient use of natural resources and raw materials, using recycled materials whenever possible, as well as the reduction of waste generation in the activities carried out. In this way, Ferrovial’s policy promotes the transition away from the use of virgin resources by increasing the use of secondary resources, sustainable sourcing and the use of renewable resources. |
| Objective | The vision of Ferrovial’s Quality and Environment Policy is to improve the future through the development and operation of sustainable infrastructure assets and cities, while being committed to the highest levels of operational excellence and innovation. This policy aims to establish the principles and values of quality and the environment that Ferrovial will ensure compliance with in all the companies within its consolidation perimeter. These principles and values include those related to resource use and the circular economy. |
| Associated material impacts, risks and opportunities |
|
| Follow-up and remediation process | Ferrovial deploys its policies through the business-specific strategies, which in turn establish governance schemes and indicators with objectives and monitoring procedures that allow the management of matters related to resource use and the circular economy to be continuously monitored and evaluated. |
| Scope of the policy | |
| Affected stakeholders | The vision of this policy is to create value for the Company and for its customers, investors and employees. It also promotes mutual value-creation in the relationships with customers, suppliers, and other external organizations to protect and improve the environment. To this end, open communication channels are established in order to create synergies, share experiences and good practices, taking advantage of those opportunities that allow the Company to create value for the Company. In terms of scope, this policy applies to:
|
| Geographic areas | Global |
| Value chain application | The objective of the Environment and Quality Policy is to develop and operate sustainable infrastructures and cities, guaranteeing the efficient use of available resources and minimizing the environmental impacts across the Company’s operations and value chain. |
| Exclusions from application | There are no exclusions from application. |
| Policy approval flow | |
| Responsible party | The principles and values of the Sustainability Policy, approved by the Board of Directors, are the basis for all other existing policies in the Ferrovial Group with implications within the field of sustainability, which have been approved by the Company and remain in force. The Quality and Environment Policy is approved by the Board of Directors, and the Quality and Environment Committee is responsible for its implementation. |
| Consistency with third-party instruments or standards | This policy is prepared under recommendations 2.1.5 and 2.1.6 of the Dutch Corporate Governance Code and is aligned with the Code of Ethics and Business Conduct, Ferrovial’s Human Rights, Corporate Responsibility and Sustainability Policies. |
| Stakeholder engagement | Ferrovial ensures ongoing and permanent information-sharing through effective communication channels, leveraging new technologies and maintaining cooperation and transparency with the competent authorities and regulators. |
| How it is made available | This policy is available on Ferrovial’s website (ferrovial.com) and through the relevant internal communication channels. |
| Significant policy changes | N/A – no changes have been made. |
E5 – 2: ACTIONS AND RESOURCES RELATED TO RESOURCE USE AND CIRCULAR ECONOMY
| Circular Economy Plan | |
| Objective | To establish circular economy principles across the Company’s operational processes, promoting the reuse and recycling of waste, and the efficient use of resources by applying circularity criteria, either through the reuse or recycling of materials in the activities. |
| Waste Hierarchy Principles | The Quality and Environment Policy and the Circular Economy Plan establish the mechanisms for the application of the waste hierarchy principles under which Ferrovial prioritizes the following waste management methods:
|
To contribute to the achievement of the objectives set out in the Circular Economy Plan, a number of actions were carried out in the field of waste management and the circular economy, aiming at reducing waste generation and, consequently, reducing greenhouse gas emissions by avoiding the transportation of materials. These main actions are carried out on an ongoing basis depending on the type of project, and some of the main good practices are presented below:
- ZERO WASTE CERTIFICATION: Ferrovial, through its Construction division, has renewed the “Zero Waste” certification in 2025 for its strong performance in waste management across projects in Spain, Portugal, the United Kingdom, Australia, and the United States. This recognition, granted by Société Générale de Surveillance (SGS), a global leader in certification and verification, endorses the company’s commitment to responsible waste management and the circular economy.Ferrovial has demonstrated traceable, efficient management aligned with stringent technical standards, meeting requirements such as:
- Minimum recovery of 90% of generated waste (maximum 10% sent to landfill)
- A traceable and detailed waste inventory by type and treatment
- Definition of reduction and recovery targets supported by action plans
- Regulatory compliance
- Documented procedures ensuring control and continuous improvement
Ferrovial has incorporated digital tools for waste traceability and control, strengthening technological innovation applied to sustainability.
Furthermore, this recognition adds value to clients and projects, enhancing trust and compliance with ESG criteria, and engages suppliers and subcontractors, extending the circular economy culture throughout the value chain.With this milestone, Ferrovial reaffirms that responsible waste management is possible, scalable, and essential to building a sustainable future.
- CIRCULAR ECONOMY, ALBERTIA TUNNEL PROJECT: A great example of the application of the circular economy is the work of the Albertia Tunnel, which is part of the Basque high-speed railway line in the territories of Alava and Gipuzkoa (Basque Country, Spain). Circular economy measures were identified that made it possible to value part of the construction waste generated on site, specifically concrete, as well as the environmental improvement caused by the reuse of the tunnel’s industrial process water, which must be treated in the treatment plant before being discharged.An authorized waste manager has collaborated with the project and has installed a mobile crushing plant on site to crush and screen the waste of concrete generated. This shredded material meets the technical requirements of the project to be used as crushing material in the filling of the cut-and-cover tunnels of the Albertia tunnel, complying with the environmental requirements required by current legislation for their recovery.
The mobile plant is equipped with a steel separator that effectively separates any remaining steel reinforcement embedded in the concrete.The project finished in 2025 with the achievement of reusing more than 15,000 tons of concrete on site. The recovery of the residual concrete has increased the circularity of the project and reduced the environmental impact, highlighting the reduction in the consumption of mineral resources, since it was planned that the filling would be made with material acquired in a quarry.The most relevant action in the sense of reducing the water footprint has consisted of an agreement with the concrete supplier, which has an exclusive concrete plant in the facilities. Since then, 100% of the concrete on the site has been made with water reused from the on-site treatment plant, which avoids having to use water from the environment. According to the specific pending needs, it has been calculated that 8,000,000 litres of water have been reused since the start of the works in August 2023.Finally, this wastewater is also used on-site for other activities such as dust prevention, fire prevention and cooling of drilling equipment, where at least 2,000,000 liters of water will be reused, in addition to the above. - ALAMO NEX CONSTRUCTION I-35 (ANC): Several waste management practices have been implemented in the Alamo Nex Construction (ANC) I-35 construction project in San Antonio, Texas, USA:
- Concrete Recycling – Several measures are implemented in the recycling of used concrete. The most recent recycling measure was to obtain a concrete crusher permit and crush the concrete debris and use it on site as flex base. Amount generated for reuse on-site by Concrete Crusher was 13,165 tons during 2025.
- Asphalt Recycling – In order to make way for the new road surface and alignment, asphalt is removed and milled. In 2025, 2,532 tons of asphalt have been milled and reused on-site.
- Metal Recycling – ANC has been making a concerted effort to ensure that all metal generated during the project is recycled. This includes, but is not limited to, rebar, guard rails, and signage. In 2025, 5,000 tons of metal were recycled.
Cadagua, water treatment activities
- BIOKAR PROJECT: The BIOKAR project (started this year and expected to end in 2027), led by CADAGUA, exemplifies a strong commitment to circular energy and the reduction of water footprint through the valorisation of sewage sludge for the production of biochar. Using advanced pyrolysis and hydrothermal carbonisation processes, CADAGUA, in collaboration with the Tecnalia technology centre, transforms sludge— traditionally considered a problematic waste—into a high-value resource: functionalised biochar. After undergoing physico-chemical activation, this material acquires adsorptive properties comparable to fossil-based activated carbon, enabling its direct use in wastewater treatment plants for the efficient removal of emerging contaminants such as pharmaceuticals and persistent organic compounds.This strategy not only reduces dependence on imported and fossil-based raw materials but also closes the resource cycle within the treatment plant itself, minimising waste generation and emissions associated with transport and disposal. Furthermore, the project includes research into the use of biochar as a raw material in construction applications, such as asphalt and concrete, adding strategic value by enabling biogenic CO₂ sequestration and further reducing the carbon footprint of these materials. The use of biochar thus contributes to the self-sufficiency of facilities, improves treated water quality, and facilitates compliance with the most stringent environmental standards.Ultimately, BIOKAR positions CADAGUA as a benchmark in innovation and sustainability, driving the circular economy in the water sector and demonstrating that advanced sludge management can become an integrated solution for protecting water resources and transitioning towards more responsible and efficient production models.
These actions are part of Ferrovial’s broader commitment to sustainability and the preservation of the natural environment, aligning with its sustainability strategy and circular economy plan. The measures implemented by the Company are directly related to the Company’s potential impacts, following the principles of the Company’s Quality and Environment Policy and are focused on achieving its objective of using natural resources and materials efficiently and reducing waste production.
Through the implementation of these actions, the circular nature of the Company’s operations is promoted by increasing the levels of resource efficiency in the use of technical materials and water, as well as significant raw materials, while seeking to achieve higher rates of reused and recycled material utilization.
For information related to employees working in Quality and Environment departments see section E3 – 2: Actions and Resources related to Water and marine resources, Cadagua, water treatment activities.
E5 – 3: TARGETS RELATED TO RESOURCE USE AND THE CIRCULAR ECONOMY
The established Circular Economy Plan includes targets, which follow the principles of the waste hierarchy (reuse, recycling and valorization), and performance indicators:
In line with the requirements of the EU Taxonomy, the Company aims to valorize at least 70% of the non-hazardous construction and demolition waste generated annually in construction activities, having recovered 76% of this waste in 2025 (75% in 2024), meeting the established target.
In the construction sector, the annual target is to valorize 80% of excavation soils. In 2025, 87% of soils excavation were valorized (90% in 2024).
Cadagua’s treatment plants are committed to the recovery of 80% of the sewage sludge generated for agricultural use, composting or thermal drying, and 85% of the sludge generated was recovered (76% in 2024).
Ferrovial´s objectives apply to the Company´s financial consolidation scope and were set on a voluntary basis. Trend analyses and the requirements of analysts and investors were considered when setting these objectives. In addition, targets were established in accordance with the principles of the Quality and Environment Policy, with a focus on the efficient use of natural resources and the use of recycled materials, reducing waste. In addition, the Company continually evaluates the effectiveness of its water-related targets and initiatives through internal reviews.
The promotion of higher circular material use rates is achieved through the reuse and recovery policies integrated into these targets. The Circular Economy Plan is designed to integrate circular economy principles into the Company’s processes, encouraging the reuse and recycling of waste, thus optimizing resource efficiency through the application of circularity criteria – either through the reuse or recycling of materials in operations – or through supply chain management to source materials with recycled content, all while reducing environmental impact.
Minimizing the use of primary raw materials is possible thanks to the reuse and recovery strategies associated with these targets. By prioritizing the reuse of materials, the consumption of these resources is significantly reduced.
The promotion of effective waste management is aligned with internal policies and procedures aimed at ensuring compliance. Waste is separated to facilitate proper handling and recovery, either by reusing it on site or by sending it to an approved waste manager for recycling.
E5 – 4: RESOURCE INFLOWS
MATERIALS PURCHASED BY WEIGHT OR VOLUME*
| 2021 | 2022 | 2023 | 2024 | 2025 | |
|---|---|---|---|---|---|
| Aggregates (t)** | – | 9,509,101 | 9,187,753 | 11,071,325 | 9,855,839 |
| Concrete (t) | 7,178,860 | 6,177,323 | 5,338,501 | 5,471,617 | 4,497,840 |
| Asphalt agglomerate (t)** | – | 765,162 | 782,783 | 737,731 | 1,037,578 |
| Cement (t*)** | – | 168,752 | 149 | 271,732 | 246,416 |
| Corrugated steel (t) | 182,651 | 128,921 | 121,552 | 127,706 | 184,587 |
| Bitumen (t) | 464,342 | 106,329 | 48,279 | 77,909 | 76,519 |
*Biological materials are not material in Ferrovial's purchases.
** Verification of these three materials was out of scope in 2021.
Note: The information on materials purchased for the jointly operated project HS2 Main Works, in which Ferrovial holds a share of 15% and which is proportionally consolidated, is not included. This information does not represent a relevant deviation in the disclosed metrics.
The volume of resources used by Ferrovial Construction is mainly concentrated in activities related to infrastructure construction, particularly the purchase of aggregates, concrete, asphalt and steel. The Company’s sustainability and circular economy strategy demonstrates a firm commitment to reducing environmental impact and optimising resources, actively promoting the integration of recycled and reused materials in its projects. In 2024, total resource consumption amounted to 17,758,020 million tonnes, with the figure for 2025 standing at 15,898,779 million tonnes.
The methodology used to calculate resource consumption is based on the analysis of purchases made for each project. The quantities are recorded in the management system under their original units of weight or volume, using reference values that ensure consistency and accurate conversion between volumetric and mass units.
E5 - 5: RESOURCE OUTFLOWS
| Waste by type | Treatment | 2022 | 2023 | 2024 | 2025 |
| Non-hazardous waste | DIVERTED FROM DISPOSAL (t) | 20,094,690 | 23,727,847 | 31,165,808 | 24,451,578⁷ |
| Preparation for reuse (t) | 18,099,015 | 21,750,885 | 28,497,438 | 19,600,754 | |
| Recycling (t) | 1,837,497 | 1,837,497 | 2,603,789 | 1,635,398 | |
| Other recovery operations (t) | 158,178 | 139,465 | 64,581 | 3,215,426 | |
| DIRECTED TO DISPOSAL (t) | 2,782,270 | 2,805,547 | 4,199,361 | 3,988,146 | |
| Landfill (t) | 2,748,871 | 2,775,523 | 4,151,002 | 3,870,948 | |
| Incineration(t) | 33,399 | 30,024 | 48,359 | 91,655 | |
| Other disposal or unknown treatment (t) | 0 | 0 | 0 | 25,543 | |
| TOTAL | 22,876,960 | 26,533,394 | 35,365,169 | 28,439,724 | |
| Hazardous waste | DIVERTED FROM DISPOSAL (t) | 17,114 | 18,577 | 1,626 | 15,778 |
| Preparation for reuse (t) | 0 | 0 | 0 | 0 | |
| Recycling (t) | 5,635 | 7,387 | 1,418 | 12,108 | |
| Other recovery operations (t) | 11,479 | 11,190 | 208 | 3,670 | |
| DIRECTED TO DISPOSAL (t) | 3,824 | 5,848 | 6,172 | 1,111 | |
| Landfill (t) | 0 | 0 | 0 | 0 | |
| Incineration (t) | 0 | 0 | 0 | 15 | |
| Other disposal or unknown treatment (t) | 3,824 | 5,848 | 6,172 | 1,096 | |
| TOTAL | 20,938 | 24,425 | 7,798 | 16,889⁸ | |
| TOTAL | DIVERTED FROM DISPOSAL (t) | 20,111,804 | 23,746,424 | 31,167,434 | 24,467,356 |
| DIRECTED TO DISPOSAL (t) | 2,786,094 | 2,811,395 | 4,205,533 | 3,989,257 | |
| TOTAL | 22,897,898 | 26,557,819 | 35,372,967 | 28,456,613 |
Note:
• 2024 waste data have been restated due to the inclusion of Construction and Demolition Waste of Webber. This data has been extrapolated considering Webber's construction and demolition waste from 2025 and the turnover for the years 2024 and 2025.
⁷ The reduction in the generation of non-hazardous waste compared to the previous year is due to the decreased generation of construction and demolition waste from the company’s construction activities.
⁸ The increase in hazardous waste compared to the previous year is due to the fact that in 2024 one of the construction companies generated a very low amount of hazardous waste
• This year Excavation Soils and Construction and Demolition waste have been included in the table of total waste.
• The information related to waste indicators for the jointly operated projects HS2 Main Works, Ontario Transit Group Constructor GP and Metro Paris Ligne 3A JV, which are proportionally consolidated, are not included. This information does not represent a relevant deviation in the disclosed metrics
| Total amount of waste not recycled | 2022 | 2023 | 2024 | 2025 |
|---|---|---|---|---|
| Total amount of waste not recycled | 21,054,766 | 24,712,935 | 32,767,761 | 26,809,107 |
| Percentage of non-recycled waste | 92 % | 93 % | 93 % | 94 % |
| Percentage of waste diverted from disposal | 88 % | 89 % | 88 % | 86 % |
Ferrovial voluntarily reports the data on excavated soils and Construction and Demolition Waste in separate tables, as these constitute the company’s most representative waste streams.
| CONSTRUCTION AND DEMOLITION WASTE | Treatment | 2022 | 2023 | 2024 | 2025 |
| Construction and demolition waste |
DIVERTED FROM DISPOSAL (t) | 3,213,352 | 3,157,554 | 1,704,911 | 1,614,439 |
| DIRECTED TO DISPOSAL (t) | 1,088,926 | 386,492 | 572,387 | 504,174 | |
| Landfill (t) | 1,088,926 | 386,492 | 572,387 | 485,760 | |
| Incineration(t) | 0 | 0 | 0 | 0 | |
| Other disposal or unknown treatment (t) | 0 | 0 | 0 | 18,414 | |
| TOTAL | 4,302,278 | 3,544,046 | 2,277,298 | 2,118,613 |
| EXCAVATION SOIL | 2022 | 2023 | 2024 | 2025 | |
| Excavation soil | DIVERTED FROM DISPOSAL (t) | 26,570,509 | 31,794,582 | 29,191,451 | 22,640,275 |
| DIRECTED TO DISPOSAL (t) | 2,882,829 | 4,059,200 | 3,393,053 | 3,281,858 | |
| Landfill (t) | 2,882,829 | 4,059,200 | 3,393,053 | 3,274,890 | |
| Incineration(t) | 0 | 0 | 0 | 0 | |
| Other disposal or unknown treatment (t) | 0 | 0 | 0 | 6,968 | |
| TOTAL | 29,453,339 | 35,853,782 | 32,584,504 | 25,922,133 |
Note: The information related to waste indicators for the jointly operated projects HS2 Main Works, Ontario Transit Group Constructor GP and Metro Paris Ligne 3A JV, which are proportionally consolidated, are not included. This information does not represent a relevant deviation in the disclosed metrics.
Composition of waste and material present
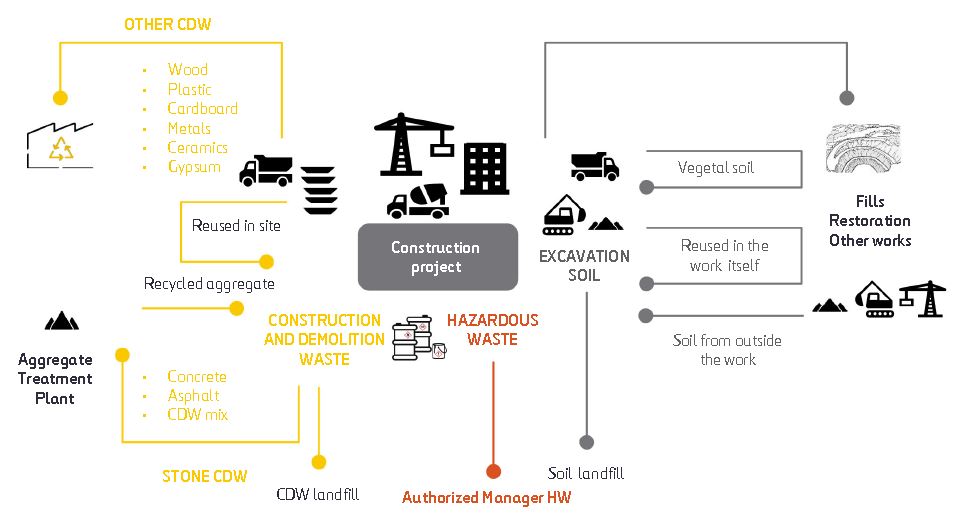
The most relevant waste streams from Ferrovial’s activities come from construction activities:
- Construction and Demolition Waste (CDW), which is mainly composed of:
- Stone CDW (concrete, asphalt and a mixture of CDW). This waste can be reused onsite through direct reuse after segregation or prior processing in an aggregate treatment plant and can also be sent to other sites.
- Other CDW (wood, plastics, cardboard, metals, ceramics and plaster). Once this waste has been segregated on site, it can be used by reusing it on site or sending it to an authorized manager for recycling.
- Excavation soil is also an important resource within the works, the management of which must incorporate circularity criteria. Soil can be managed by reusing it on site or sending it to other locations as fill or for restoration. Soil can also be brought from other sites for use.
- In terms of the management of CDW and excavation soil, the aim is to ensure that disposal in a landfill remains the last option following the waste hierarchy.
- Regarding hazardous waste and non-hazardous waste (other than CDW and soil), proper segregation and storage of waste is carried out, as indicated by the regulations of each area in which the Company operates, and subsequently sent to an authorized manager.
The rest of materials that are present in the waste generated by Ferrovial’s activities are very similar, despite the specific waste generated by water treatment plants (i.e. sewage sludge, sand, fats and oils). The following table details the materials present in Ferrovial’s waste:
| Construction and demolition waste | Non-hazardous waste | Hazardous waste |
|---|---|---|
| Concrete | Urban assailable waste: – Packaging – Paper and cardboard – Glass – Organic matter – Other non-recyclable waste |
Hazardous packaging (paint, solvent, etc.) |
| Asphalt and bituminous mixtures | Wood | Contaminated absorbents |
| Debris | Bulky | Contaminated used oils |
| Wood | Vegetal waste | Oil filters |
| Plastic | Scrap | Sprays and aerosols |
| Carboard | Sands | Electrical and electronic equipment, batteries |
| Metals | Fats and oils | Water with hydrocarbons |
| Ceramics | Sewage sludge | Contaminated soil |
| Gypsum | Fiber cement (asbestos) | |
| Used tires |
*Radioactive waste is not generated by Ferrovial’s activity
The waste produced is reported annually by all business lines, including both its generation and the type of treatment it receives. For reporting purposes, operational control is considered an organizational boundary. Under this approach, a company accounts for data from those sources over which it has full authority to introduce and implement its operational policies, regardless of its shareholding in the Company. The Company has a specific corporate reporting tool through which the environmental heads of each business unit report their data. Companies also have their own methods of recording waste. Waste is consolidated by type of waste and disaggregated by treatment type. When the treatment type is unknown, the Company takes the worst-case scenario, assuming that the waste is earmarked for disposal. No estimates were made, since the data is recorded from authorized waste managers’ information. No other external body has participated in the validation of this metric.