ENVIRONMENTAL INFORMATION
ESRS E1 Climate change
SBM – 3: MATERIAL IMPACTS, RISKS AND OPPORTUNITIES AND THEIR INTERACTION WITH STRATEGY AND BUSINESS MODEL(S)
| Stage* | Description | Likelihood of occurrence | Time horizon | ||
| Climate change adaptation | |||||
| (+) Impact | OP | Development of sustainable and resilient infrastructure that provides solutions for climate change adaptation. | Current | S | |
| Risk | OP | Increase in maintenance and extraordinary repairs in infrastructure resulting from severe weather events. | L | ||
| Opportunity | OP | New opportunities for the development of sustainable and resilient infrastructure and services that support climate change adaptation, potentially generating competitive advantages through differential solutions. | S | ||
| Climate change mitigation and Energy | |||||
| (+) Impact | VC | Promote sustainable practices aimed at reducing carbon footprint and contributing to a cleaner and healthier environment. | Current | S | |
| (+) Impact | OP, Pt | Improvement of the environmental performance of Ferrovial’s projects (energy efficiency, emission reduction, etc.) enabled by the implementation of new technologies in the production process and digital management tools that support impact quantification. | Current | S | |
| (-) Impact | VC | GHG emissions generated by the Company’s activities. | Current | S | |
| Risk | VC | Increase in, and/or non-compliance with legislative requirements or objectives linked to climate change and lack of availability of new technologies. | L | ||
| Opportunity | OP, C | Development of energy infrastructure, energy efficiency services, renewable energy generation and solutions to mitigate mobility-related emissions. | S | ||
OP: Own operations; VC: Value Chain; Pu: Purchases; C: Customers; Pt: Partners; S: Short term; M: Medium term; L: Long term.
Ferrovial applies the recommendations of the TCFD in the process of identifying, analyzing and managing risks and opportunities related to climate change in order to carry out a resilience analysis of the Company; for more information see IRO-1 in the ESRS2 General Information section.
The Company annually evaluates and quantifies risks related to its own operations across all its business units and geographies for different time horizons (short, medium and long term: 2025, 2030 and 2050) and climate scenarios. These scenarios reflect fundamental assumptions about how the transition to a low-carbon and resilient economy will influence related macroeconomic trends, energy consumption and mix, as well as expected technological development. The Company has a range of measures to adapt and mitigate the potential adverse effects of the identified risks, such as the adaptation of infrastructure design to climate change, the development of maintenance plans with greater frequency and climate considerations, establishing a decarbonization pathway of the Company with clear levers and ambitious objectives and, and relying on expert personnel and the continuous promotion of innovation in the field of infrastructures, among other measures. Sustainable and resilient infrastructure projects are designed to mitigate the risks to which the Company is exposed and guarantee long-term operational stability. Accordingly, through the aforementioned scenario analysis and the measures implemented by Ferrovial, it ensures that the Company’s strategy and business model are resilient and adaptable to future climate conditions.
The methodology for climate risks is based on the Ferrovial Risk Management (FRM) methodology. This approach assesses the likelihood of risk occurrence, the impact on the Company, and its frequency. This resilience analysis is reviewed and updated in accordance with the FRM guidelines.
The methodology considers transition scenarios, based on the degree of implementation of climate change policies, presented annually by the International Energy Agency in the World Energy Outlook:
- Stated Policies Scenario (STEPS). It takes into account current policies defined at the sectoral level, as well as those announced by countries. This scenario would imply a global temperature increase of 2.4-2.8ºC by 2100.
- Announced Pledges Scenario (APS) A scenario in which it is assumed that all climate commitments set by governments around the world, including Nationally Determined Contributions and long-term net-zero targets, will be met on time and on budget. This scenario would imply a global temperature increase of 1.9-2.3°C by 2100.
- Net Zero Emissions scenario by 2050 (NZE). It shows a challenging but achievable pathway in which the global energy sector achieves net CO2 emissions by 2050, with advanced economies reaching that target ahead of others. This scenario would imply a global temperature increase of 1.3-1.5°C by 2100.
Physical climate scenarios consider anthropogenic changes through greenhouse gas concentration pathways, known as Representative Concentration Pathways (RCPs).
- RCP 4.5. Emissions peak around 2040 and then decline. In this scenario, the temperature could rise by 2.6°C by 2100.
- RCP 8.5. Emissions continue to increase until they double by 2050, commonly referred to as the business-as-usual scenario. The average global temperature exceeds 4.4ºC in 2100.
To analyze physical climate risks, Ferrovial, in collaboration with the Institute of Environmental Hydraulics of the University of Cantabria, has developed the ADAPTARE Climate Risk and Adaptation methodology and tool. ADAPTARE is based on the EU Taxonomy and follows the methodology of the framework proposed by the IPCC, considering three variables: climate-related risks, vulnerability (sensitivity and adaptability of the asset) and exposure (characterization and valuation of assets) of the infrastructure, taking into account the geolocation of infrastructure assets worldwide. The tool uses different datasets to characterize infrastructure and climate projections, modeling climate risk by describing changes in risk levels for the physical climate scenarios and time horizons mentioned above.
The time horizons consider the duration of the contracts associated with the assets evaluated. Infrastructure assets with long-term concession or owned by the Company are analyzed; by considering the selected time horizons, the Company can identify the main climate risks over the life cycle of its assets and implement adaptation measures, which are not linked on a one-to-one basis, these apply across multiple risks, since a single mitigation action can address several different ones to develop more resilient infrastructures.
Below are the results of the Company’s resilience analysis, stating the main climate risks and their mitigation and/or adaptation measures:
| Physical risks: Physical risks arising from climate change can lead to potential (acute) events or long-term (chronic) changes in weather patterns. There may be financial implications for organizations, including direct damage to assets or indirect impacts caused by disruptions in the production chain. | ||
|---|---|---|
| Physical climate scenarios | Main climate risks | Mitigation and/or adaptation measures |
|
A physical risk analysis was performed. First, the following climate hazards that could affect certain infrastructure assets within different lines of business were identified:
These climate hazards could lead to risks of increased maintenance requirements, shutdowns, and/or extraordinary repairs. More information about the risk assessment can be found in IRO-1 in the ESRS2 General Information section. |
|
*The risks have been ranked according to their potential financial impact on the Company, with the highest-priority or highest impact risks for each type of risk (physical or transition) being included at the top of the list.
| Transition risks: The transition to a low-carbon economy may result in potential political, legal, technological, and market changes aimed at addressing climate change-related mitigation and adaptation requirements. Depending on the nature, speed and scope of these changes, transition risks may involve financial and/or reputational risks to varying degrees. | ||
|---|---|---|
| Climate transition scenarios | Main climate risks | Mitigation and/or adaptation measures |
|
|
|
*The risks have been ranked according to their potential financial impact on the Company, with the highest-priority or highest impact risks for each type of risk (physical or transition) being included at the top of the list.
With regard to opportunities, Ferrovial carries out a periodic assessment following the methodology mentioned above. The results are as follows:
| Opportunities related to climate change | |||
|---|---|---|---|
| Mobility | Water | Energy | Infrastructure |
Innovative solutions to mitigate emissions associated with mobility that include connectivity between infrastructure, vehicles and users, vehicle sharing and the electrification of transport, reducing congestion and pollution in cities.
|
Cadagua contributes to addressing the effects of climate change on water resources, focusing its business on the design, construction, operation and maintenance of water treatment facilities, enhancing resource availability in the natural environment and for human consumption.
|
Comprehensive solutions for the development, construction, management, and operation of energy infrastructures, as well as energy management services.
|
New opportunities for the development of sustainable and resilient infrastructures that offer solutions for adaptation to climate change, providing competitive advantages through differentiated solutions.
ADAPTARE. The Company, in collaboration with an IPCC (Intergovernmental Panel on Climate Change) expert, has developed a proprietary methodology to identify, analyze and assess the physical risks related to climate change and propose adaptation measures to mitigate the impacts they may cause on the infrastructure. This methodology is applied to the different types of projects that the Company develops and operates around the world. The analysis is carried out in the short, medium and long term in different climate scenarios.It takes into account the risk framework defined by the IPCC, as well as the adaptation criteria established in the EU Taxonomy Regulation.ADAPTARE automates this methodology and facilitates analysis and interpretation for project managers and developers. |
E1 – 1: TRANSITION PLAN FOR CLIMATE CHANGE MITIGATION
Ferrovial has had a 2030 Climate Strategy since 2011, which is part of the Company’s strategic plan and aligned with its sustainability strategy.
The Quality and Environment Steering Committee, chaired by the Sustainability Director (who also serves as the Committee’s secretary), is the body that executes the corporate climate change strategy in all the businesses that make up the Company. It is the forum where the results related to climate change projects are discussed, decisions are made, initiatives are defined and reviewed, as well as the application of the Quality and Environment policy throughout the Company. This committee analyzes aspects such as legislation, new legislative challenges in the countries in which the Company operates and market trends, as well as the recommendations of government agencies and other organizations.
The Quality and Environment Steering Committee is composed, in addition to the Corporate Sustainability Director, by the highest representatives of the companies in this field. Committee meetings are held at least quarterly and may be more frequent if necessary.
The Climate Strategy 2030 was approved and is monitored annually by the Management Board. Since 2022 (FY 2021), the Company has been committed to the “Say on Climate” initiative, which consists of presenting Ferrovial’s Annual Climate Strategy Report at the General Shareholders’ Meeting, for an advisory vote. In this way, in 2017 it has become the first Spanish company to undertake this commitment, and the first in its sector on a global scale.
One of the cornerstones of the strategy is the Deep Decarbonization Path (DDP) plan, which establishes the mitigation lines that must be worked on to achieve the 2030 emission reduction targets. Since 2017, Ferrovial’s 2030 Climate Strategy has had reduction targets validated by the Science Based Target Initiative (SBTi), the most recognized organization for establishing emission reduction targets. In 2025, Ferrovial obtained new SBTi-validated targets aligned with a 1.5 °C pathway, the information for which can be found in section ESRS E1-4: Targets Related To Climate Change Mitigation And Adaptation.*
* Ferrovial is not excluded from EU Paris-aligned Benchmarks
The Climate Strategy establishes a roadmap to decarbonize business activities, and through the Deep Decarbonization Path (DDP) Ferrovial sets the mitigation levers to work on to achieve the 2030 emissions reduction targets. The levers include the use of renewable electricity, energy efficiency measures, exploration of technology alternatives for low-carbon heavy machinery, transitioning to an electric and more efficient vehicle fleet, and promotion of biofuels. These decarbonization actions are integrated into business decision-making, ensuring a structured transition by promoting low-carbon solutions throughout the value chain. For further information about the decarbonization levers included in the Deep Decarbonization Path, see the section “ESRS E1-3: Actions And Resources In Relation To Climate Change Policies.”
Blocked emissions:
Ferrovial considers emissions related to waste management and treatment processes from assets in the United Kingdom and Poland as blocked emissions in 2030. These emissions are taken into account when developing the decarbonization plan (including emissions reduction by leverage) and setting emissions reduction targets, so that they do not compromise compliance with actions and targets related to the transition plan aligned with a 1.5°C pathway.
Traffic emissions related to the Company’s concessions are not considered blocked emissions, Ferrovial does not include these emissions generated by customers in its carbon footprint inventory; these are considered as indirect use-phase emissions and are categorized as out-of-scope emissions. However, the Company will continue to report and verify these emissions when deemed appropriate and will work, to the extent possible, to reduce such emissions even if they are not found within its reduction targets.
Progress in the implementation of the Transition Plan:
SCOPE 1&2 ABSOLUTE EMISSION REDUCTION TARGETS
-
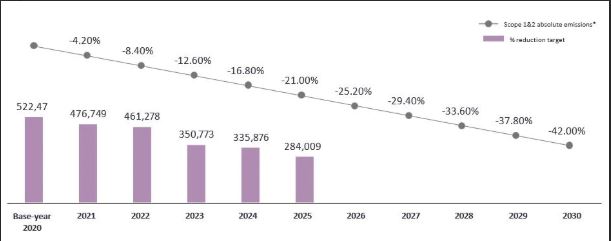
*Scope 2 emissions are market-based.
E1 - 2: POLICIES RELATED TO CLIMATE CHANGE MITIGATION AND ADAPTATION
| Policy | Quality & Environmental policy |
|---|---|
| Description | Ferrovial, through its Quality and Environment Policy, aims to add value to its stakeholders, by developing and operating sustainable infrastructures and cities, leveraging talent, integrity, safety, excellence and innovation and ensuring the efficient use of available resources and minimizing the environmental impact of its activities. With this policy, it manages the risks and opportunities linked to climate change in all its activities, providing resilient and low-emission infrastructures and services. In addition, through the development of energy infrastructure, energy efficiency services, and the generation of renewable energy, among others, the Company is committed to reducing greenhouse gas emissions. |
| Objective | Benefit stakeholders by creating sustainable infrastructure and cities through talent, integrity, safety, excellence and innovation. Ferrovial addresses carbon and climate-related risks and opportunities across its portfolio of activities and focuses on providing low-carbon infrastructure and services |
| Associated material impacts, risks and opportunities |
|
| Follow-up and remediation process | Ferrovial deploys its policies through the sustainability strategies of each business unit, which establish governance frameworks and performance indicators, with objectives and monitoring procedures that allow continuous control and evaluation of the management of mitigation-related issues and climate change adaptation. |
| Scope of the policy | |
| Affected stakeholders | The vision of this policy is to create value for the Company and for its customers, investors and employees. It also promotes mutual benefit in the relationships with customers, suppliers, and other external organizations to protect and improve the environment. To this end, open communication channels are established in order to foster synergies, share experiences and good practices, and leverage of opportunities that allow the Company to create value.
In relation to the scope of application, this policy applies to:
|
| Geographic areas | Global |
| Value chain application | The objective of the Environment and Quality Policy is to develop and operate sustainable infrastructures and cities, ensuring the efficient use of available resources and minimizing the environmental impact of the Company’s activities and the value chain. |
| Exclusions from application | There are no exclusions from application. |
| Policy approval flow | |
| Responsible party | The principles and values of the sustainability policy, approved by the Board of Directors, are the basis for the rest of the Ferrovial Group’s existing policies that have sustainability implications, which have been approved by the Company and remain in force. The Quality and Environmental Policy was approved by the Board of Directors, and the Quality and Environment Committee is responsible for its implementation. |
| Consistency with third-party instruments or standards | This policy is prepared under recommendations 2.1.5 and 2.1.6 of the Dutch Corporate Governance Code and is aligned with the Code of Ethics and Business Conduct, Ferrovial’s Human Rights, Corporate Responsibility and Sustainability Policies. |
| Stakeholder engagement | Ferrovial ensures ongoing and permanent information-sharing through effective communication channels, leveraging new technologies and maintaining cooperation and transparency with the competent authorities and regulators. |
| How it is made available | This policy is available on Ferrovial’s website (ferrovial.com) and through the internal communication channels. |
| Significant policy changes | N/A – no changes have been made. |
E1 – 3: ACTIONS AND RESOURCES IN RELATION TO CLIMATE CHANGE POLICIES
The main actions on climate change, according to each of the decarbonization levers, are set out below:
Decarbonization levers:
The climate strategy establishes the roadmap to decarbonize business activities through the use of renewable energies instead of fossil fuels, while also developing new lines of business aimed at achieving the decarbonization of the economy and combating the effects of climate change.
The Deep Decarbonization Path (DDP), which sets out the mitigation lines to be addressed to achieve the 2030 emissions reduction targets, is based on:
- Fleet of electric and more efficient vehicles (expected reduction: 17,000-22,000 tCO2eq).
- Reducing emissions associated with construction machinery through the implementation of energy efficiency measures by 2030 (expected reduction: 800-3,000 tCO2eq).
- Reducing emissions from asphalt plants through energy efficiency by 2030 (expected reduction 7,000-12,000 tCO2eq).
- Use of cleaner fuels: promotion of biofuels (expected reduction: 13,000-18,000 tCO2eq).
- Consumption of 100% electricity from renewable sources: self-generation and procurement of renewable energy (100% of electricity from renewable sources – target for 2025) (expected reduction: 30,000-40,000 tCO2eq).
Ferrovial expects to be able to reduce Scope 1 emissions by 37,000 – 55,000 tCO2eq and Scope 2 emissions by 30,000 – 40,000 as a result of these decarbonization levers by 2030 (vs 2020).
The Group proactively manages its procurement process, focusing on embedded carbon reduction throughout the supply chain, especially in construction activities. Among the main initiatives and projects of the decarbonization strategy for Scope 3 emissions are:
- Promotion of low-carbon products, in particular cement and concrete – Ferrovial works in collaboration with its most important suppliers to progressively integrate low-carbon cement on an industrial Ferrovial has launched a Supplier Collaboration Program to work with them and better understand their emissions profiles.
- Development of new raw materials with lower embodied carbon, using new technologies and innovative approaches (e.g. reducing the carbon content of modified asphalt bitumen by introducing recycled materials).
- Using a green procurement catalog to promote sustainable product procurement.
- Utilizing engineering design to reduce the use of the most carbon-intensive raw materials, which also improves efficiency in the construction process.
- The Group encourages local procurement, where products are available, to minimize emissions from the transport and distribution of goods, and prioritizes low-carbon modes of transport, where possible, encouraging key suppliers to accelerate their adoption of low-carbon transport.
- These actions are expected to reduce 500,000-540,000 tCO2eq.
- Using a green procurement catalog to promote sustainable product procurement (expected reduction: 15,000-20,000 tCO2eq).
- The Company, through its Circular Economy Plan, aims to increase recycling and reuse opportunities, especially in construction activities; the Plan includes actions such as the reuse of excavation in civil works (mainly transport infrastructure projects) and the on-site recycling of concrete/ asphalt from demolition work (expected reduction: 80,000-85,000 tCO2eq).
Ferrovial expects to be able to reduce its Scope 3 emissions by between 595,000 and 645,000 tCO2eq as a result of these decarbonization levers by 2030 (vs 2020).
The deployment of these decarbonization lines is not linear over time and will depend on their technological viability and economic efficiency. The transition plan is reviewed annually and the investment required to implement it is included in the financial planning, in order to ensure its viability in the future. For more information see section ESRS 2 General information, Minimum disclosure requirements (MDR-A).
The investments made by Ferrovial under Delegated Regulation 2021/2178 are not directly related to the Deep Decarbonization Path (DDP), as they are associated with the development of third-party projects or activities that have an impact outside the perimeter of Ferrovial’s footprint while the company’s main activity is not the management or operation of assets but rather their construction.
In addition to the actions described in the DDP framework, the Company continuously evaluates opportunities for collaboration with key stakeholders with the aim of identifying, promoting and developing strategic projects that contribute significantly to the reduction of emissions, in alignment with corporate commitments on sustainability and climate action.
E1 – 4: TARGETS RELATED TO CLIMATE CHANGE MITIGATION AND ADAPTATION
Ferrovial’s 2030 Climate Strategy has ambitious objectives aligned with international agreements, and establishes the roadmap for the decarbonization of the Company’s activities through emission reduction targets endorsed by the Science Based Target Initiative (SBTi).
Since July 2024, Ferrovial has embarked on the process of obtaining new targets aligned to 1.5 °C, which were validated by the SBTi in February 2025. The Company sought to increase the level of ambition of the short-term targets and set the goal of achieving net zero emissions by 2050 or earlier.
The validated objectives are:
- Reduce Scope 1 and 2 emissions by 42% by 2030 (base year 2020) in absolute terms.
- Reduce Scope 33 emissions by 25% by 2030 (base year 2020) in absolute terms.
- Reduce Scope 1, 2 and 3 emissions by 90% by 2050 (base year 2020) in absolute terms.
The new targets were presented to the governing body. The Climate Strategy Report 2025, which includes these new targets, will be put to an advisory vote at the Annual General Shareholders’ Meeting.
The scope of the targets is the same as that of the GHG emissions reported in the section ESRS E1-6 Gross Scopes 1,2,3 And Total GHG Emissions, and they are based on market-based emissions. Additionally, the target values and base year emissions are also detailed in this section.
For more information on the climate scenarios considered to determine the decarbonization levers, see the section IRO-1 in ESRS 2 General information and SBM-3.
Ferrovial has had Scope 1, 2 and 3 reduction targets since 2017. In 2024, with the update of its reduction targets for all areas following the SBTi guidelines, 2020 was established as the new base year, representative of the Company’s activity in all areas. The targets were established in accordance with the principles of the Quality and Environment Policy, with a focus on carbon management and climate risks and opportunities in the Company’s activities aimed at the development of low-carbon infrastructure and services.
Although Ferrovial does not have a formalized process of direct collaboration with its stakeholders to determine its objectives, the Company continuously evaluates the effectiveness of its climate change mitigation and adaptation objectives and initiatives through internal evaluations.
3 It includes purchased goods and services, upstream transportation, waste generated in operations, and fuel and energy. Scope 1 and 2 targets are aligned with limiting global temperature increase to 1.5°C. The Scope 3 target is at the threshold of “well below 2°C”.
E1 - 5: ENERGY CONSUMPTION AND MIX
| Energy consumption and mix | 2024 | 2025 |
|---|---|---|
| (1) Fuel consumption from coal and coal products (MWh) | 56,301.23 | 47,002.17 |
| (2) Fuel consumption from crude oil and petroleum products (MWh) | 713,552.39 | 822,305.28 |
| (3) Fuel consumption from natural gas (MWh) | 12,193.02 | 15,051.87 |
| (4) Fuel consumption from other fossil sources (MWh) | 0.00 | 166.38 |
| (5) Consumption of purchased or acquired electricity, heat, steam, and cooling from fossil sources (MWh) | 49,219.86 | 2,821.36 |
| (6) Total fossil energy consumption (MWh) (calculated as the sum of lines 1 to 5) | 831,266.50 | 887,347.05 |
| Share of fossil sources in total energy consumption (%) | 85.62 % | 80.84 % |
| (7) Consumption from nuclear sources (MWh) | 2,227.30 | 1,585.09 |
| Share of consumption of nuclear sources in total energy consumption (%) | 0.23 % | 0.14 % |
| (8) Fuel consumption for renewable sources, including biomass (also comprising industrial and municipal waste of biologic origin, biogas, renewable hydrogen, etc.) (MWh) | 0 | 1215.66 |
| (9) Consumption of purchased or acquired electricity, heat, steam, and cooling from renewable sources (MWh) | 89,206.87 | 153,574.67 |
| (10) The consumption of self-generated non-fuel renewable energy (MWh) | 48,147.79 | 53,989.86 |
| (11) Total renewable energy consumption (MWh) (calculated as the sum of lines 8 to 10) | 137,354.65 | 208,780.18 |
| Share of renewable sources in total energy consumption (%) | 14.15 % | 19.02 % |
| Total energy consumption (MWh) (calculated as the sum of lines 6, 7 and 11) | 970,848.45 | 1,097,712.33 |
Note: Coal and coal product consumption for 2024 has been adjusted using specific calorific values for each reported fuel type.
| Energy intensity per net revenue | 2024 | 2025 | 2025 VS 2024 |
|---|---|---|---|
| Total energy consumption from activities in high climate impact sectors per net revenue from activities in high climate impact sectors (MWh/M€) | 106.14 | 114.02 | +7,4% |
Note: The energy included as electricity consumption from renewable sources has the corresponding certificates of guarantee of renewable origin guarantee certificates of renewable origin as established with our electricity marketing companies. The consumption and share of consumption from nuclear sources is calculated based on the residual mix. Ferrovial, as a company that operates in the infrastructure sector, has activities in its business lines that are listed in NACE Sections A to H and Section L, considered as sectors with high climate impact (as defined in the Regulation (EU) 2019/2088 and Annex 1 of the related Delegated Regulation). Therefore, all Ferrovial’s activities have been included in the calculation of total energy consumption and energy intensity. The data for 2024 has been adjusted due to a recalculation of coal consumption.
Revenue is taken from the consolidated income statement amount (see note 2.1 of the Consolidated Annual Accounts for further information).
| Energy production | 2024 | 2025 | 2025 vs. 2024 |
| Renewable energy (MWh) | 96,229 | 53,990 | -43.9 % |
| Non-renewable energy (MWh) | 1,876 | 1,571 | -16.3 % |
Note: Renewable and non-renewable energy for 2024 has been adjusted according to an update un Budimex's data. In 2025, the production of renewable energy does not include energy from Thalia due to lack of access to information.
E1 - 6: GROSS SCOPES 1, 2, 3 GHG EMISSIONS AND TOTAL GHG EMISSIONS
| Retrospective Milestones and target years | |||||||
| Base year 2020 | 2024 | 2025 | 2025 VS 2024 | 2030 | 2050 | Annual target % / Base year | |
|---|---|---|---|---|---|---|---|
| Scope 1 GHG emissions | |||||||
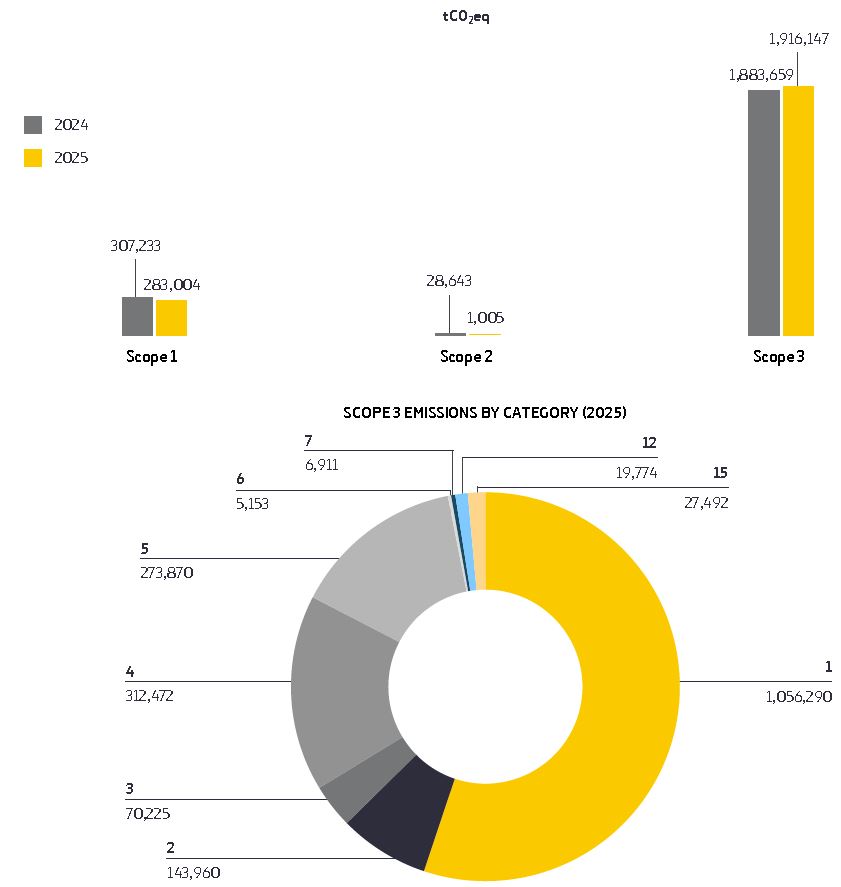
| Gross Scope 1 GHG emissions (tCO₂eq) | 475,415 | 307,233 | 283,004 | -8 % | 303,034 | 47,542 | 3.63 % |
| Percentage of Scope 1 GHG emissions from regulated emission trading schemes (%) | 0% | 0% | 0% | 0% | 0% | 0% | |
| Scope 2 GHG emissions | |||||||
| Gross location-based Scope 2 GHG emissions (tCO₂eq) | 75,974 | 68,654 | 66,789 | -3% | 37,625 | 7,597 | |
| Gross market-based Scope 2 GHG emissions (tCO₂eq) | 47,058 | 28,643 | 1,005 | -96 % | 0 % | 0 % | 10 % |
| Significant Scope 3 GHG emissions | |||||||
| Total Gross indirect (Scope 3) GHG emissions (tCO₂eq) | 2,458,654 | 1,883,659 | 1,916,147 | 2 % | 1,559,011 | 245,865 | 3.66 % |
| 1 Purchased goods and services | 1,384,872 | 920,787 | 1,056,290 | 15 % | 1,286,512 | 138,487 | |
| 2 Capital goods | 309,106 | 153,622 | 143,960 | -6 % | n/a | 30,911 | |
| 3 Fuel and energy-related Activities (not included in Scope1 or Scope 2) | 72,338 | 79,984 | 70,225 | -12 % | 65,399 | 7,234 | |
| 4 Upstream transportation and distribution | 405,4633 | 361,213 | 312,472 | -13 % | n/a | 40,546 | |
| 5 Waste generated in operations | 214,557 | 303,293 | 273,870 | -10 % | 207,100 | 21,456 | |
| 6 Business travel | 1,159 | 5,303 | 5,153 | -3 % | n/a | 116 | |
| 7 Employee commuting | 16,851 | 16,504 | 6,911 | -58 % | n/a | 1,685 | |
| 8 Upstream leased assets | n/a | n/a | n/a | n/a | n/a | n/a | |
| 9 Downstream transportation and distribution | n/a | n/a | n/a | n/a | n/a | n/a | |
| 10 Processing of sold products | n/a | n/a | n/a | n/a | n/a | n/a | |
| 11 Use of sold products | n/a | n/a | n/a | n/a | n/a | n/a | |
| 12 End-of-life treatment of sold products | 29,176 | 21,267 | 27,492 | 29 % | n/a | 2,513 | |
| 13 Downstream leased assets | n/a | n/a | n/a | n/a | n/a | n/a | |
| 14 Franchises | n/a | n/a | n/a | n/a | n/a | n/a | |
| 15 Investments | 25,132 | 21,267 | 27,492 | 29 % | n/a | 2,513 | |
| Total GHG emissions | |||||||
| Total GHG emissions (location-based) (tCO₂eq) | 3,010,043 | 2,259,545 | 2,265,940 | 0.3 % | 1,899,670 | 301,004 | 3.69 % |
| Total GHG emissions (market-based) (tCO₂eq) | 2,981,127 | 2,219,534 | 2,200,155 | -0.9 % | 1,862,045 | 293,407 | 3.75 % |
| Biogenic emissions | |||||||
| Gross biogenic emissions (tCO₂eq) | 1,029,851 | 138,927 | 161,152 | 16 % | |||
| Out of scopes emissions | |||||||
| Gross emissions outside the scope (tCO₂eq) | 1,405,895 | 2,288,243 | 2,637,663 | 15 % | |||
Note:
| GHG intensity per net revenue | 2023 | 2024 | 2025 | 2025 vs. 2024 |
|---|---|---|---|---|
| Total GHG emissions (location-based) per net revenue (tCO₂eq/M€) | 324.59 | 235.37 | 235.4 | -5 % |
| Total GHG emissions (market-based) per revenue (tCO₂eq/M€) | 321.2 | 228.54 | 228.56 | -6 % |
Note: Data relating to Ferrovial's total revenue have been obtained as reported in the consolidated income statement for the year 2025. 2024 figures has been updated due to Scope 3 recalculations.
Methodology
Since 2009, the carbon footprint (scope 1 and 2) has been calculated and reported for 100% of activities under the operational control approach as an organizational boundary. In relation to the requirements of the ESRS, the scope of the carbon footprint includes the entire financial consolidation perimeter, with the exception of two joint ventures operated by the Company in the United Kingdom, the impact of which is not considered material. The Scope 1 and Scope 2 GHG emissions included all entities within the consolidated accounting group. The calculation methodology is based on the GHG Protocol (WRI&WBCSD) and is aligned with ISO 14064-1:2018. However, additional methodologies are applied to address specific aspects of the business, such as the UK DEFRA methodology and Scope 3 operations, and the EPER methodology for estimating diffuse emissions from landfills.
As part of its Carbon Footprint procedure, Ferrovial recalculates its inventory whenever there are structural changes or new activities relevant to the Company, a change in the calculation methodology (emission factors, approach, etc.) or changes in annual consumption, in order to ensure the comparability of the information between the different years.
The GHG emissions generated by Ferrovial’s activities are classified as follows:
DIRECT EMISSIONS (SCOPE 1)
Those from sources owned or controlled by the Company. They mainly come from:
- Fuel combustion in stationary sources to produce electricity, heat or steam, including the incineration of solid waste.
- Fuel combustion in vehicles owned or controlled by the Company.
- Diffuse emissions: emissions not attributable to a single point source, such as biogas emissions from landfills.
- Fugitive emissions: emissions from refrigerants.
INDIRECT EMISSIONS (SCOPE 2)
Generated as a result of the consumption of purchased electricity, heat and cooling from other companies that produce or control it.
The calculation of GHG emissions includes the CO2 equivalence of the following gases: CO2, CH4, N2O, HFCs, PFCs, SF6 and NF3.
Emissions from carbon credits or allowances purchased, sold or transferred have not been included in the calculation of indirect GHG emissions when generating energy (Scope 2). In terms of scope 2 consumption of electricity, heat and cooling: 23.2% originate from Energy Attribute Certificates (EACs), 25.7% from self-consumed electricity of 100% renewable sources, 49.8% from renewable electricity contracts with suppliers and 1.3% from non-renewable district heating supply.
INDIRECT EMISSIONS (SCOPE 3)
Since 2012, Ferrovial has calculated all Scope 3 emissions following the guidelines established in the Corporate Value Chain Accounting and Reporting Standard (Scope 3) published by the GHG Protocol Initiative, WRI and WBCSD. Ferrovial calculates 9 out of the 15 categories included in the Corporate Value Chain (Scope 3), the standard accounting document and the Company’s information. 92% of Scope 3 GHG emissions have been calculated using primary data. The categories that do not apply are:
- Downstream transportation and distribution. Ferrovial does not sell transported or stored products.
- Processing of the products sold. Ferrovial does not have products that are going to be transformed or included in another process to obtain another product.
- Downstream leased assets. Ferrovial has no assets that it leases to other companies.
- Franchises. Ferrovial does not act as a franchisor.
- Use of sold products: Ferrovial has no direct emissions in the phase of use of the products or services sold by the Company
- Upstream leased assets: Ferrovial does not operate assets leased by the Company in the reporting year and that are not already included in the reporting Company’s Scope 1 or 2 inventories.
The calculation methodology applied to the relevant categories is as follows:
| Category | Description | Methodology for calculating applicable categories |
| 1 | Purchased goods and services | This section includes emissions related to materials purchased by Ferrovial for use in products or services offered by the company. Includes emissions from the different phases of the life cycle: extraction, preprocessing and manufacturing. Excludes the use and transport phase. This category includes the most relevant materials from an environmental and purchasing volume point of view, such as bitumen, concrete, steel, aggregates, cement and asphalt agglomerate. The methodology consists of applying a specific Defra conversion factor to the quantity of these materials purchased. |
| 2 | Capital goods | This category includes all upstream (i.e., cradle-to-gate) emissions from the production of capital equipment purchased or acquired by the company in the year, including total net additions, plant and machinery, fixtures, fittings, tooling and furniture. EPA (United States Environmental Protection Agency) sector specific economic conversion factors are used. |
| 3 | Fuel -and energy- related activities (not included in Scope 1 or Scope 2): | This section considers the energy required to produce the fuels and electricity consumed by the Company, as well as electricity transmission and distribution losses. To calculate the emissions corresponding to fuels (gasoline, diesel, natural gas, propane, LPG…) and electricity, DEFRA well-to-tank (WTT) emission factors are applied. For electricity loss in transportation, the conversion factor applied is country-specific and comes from the International Energy Agency. |
| 4 | Upstream transportation and distribution |
The emissions under this category are related to the transportation and distribution of the materials purchased by Ferrovial that are included in the purchased goods and services category. DEFRA conversion factors are applied to each type of transportation considering the distance travelled. |
| 5 | Waste generated in operations | The emissions in this section are related to the waste generated by the Company’s activity that has been declared during the year. DEFRA emission factors are applied to each of the quantities of this waste. This section includes:
|
| 6 | Business travel | This category includes emissions associated with business travel, whether by train, plane, taxi or rented vehicles used for travel. For this category, data provided by the travel agency or accounting data such as the type of trips, trips or expenses are used. The DEFRA emission factors are applied to these data to obtain the emissions associated with each type of journey. Emissions from well-to-tank (WTT) and from tank-to-wheel (TTW) are included. |
| 7 | Employee commuting | This category includes emissions from employees commuting between their homes and workplaces. Ferrovial calculates the emissions of employees in construction, infrastructure and central office functions across the Ferrovial Group in Spain and Poland.
The information required is:
To obtain information on the type of transport modes used and distances, employee mobility surveys were conducted. DEFRA emission factors are applied to these data to calculate emissions related to each type of journey. Both “well-to-tank” (WTT) and “tank-to-wheel” (TTW) emissions are included. |
| 12 | End-of-life treatment of sold products: | This category includes emissions from the disposal of waste generated at the end of the useful life of products sold by Ferrovial in the reporting year. Ferrovial offers services and products. Services, being labor based, do not generate emissions associated with this category. As for the products sold, they correspond to constructed infrastructure assets. In this case, the most relevant materials, from an environmental point of view and by volume, that are included in the construction of infrastructures are wood, paper, barriers, asphalt and concrete. Therefore, at the end of the useful life of the infrastructures, the waste that must be managed corresponds to them. These products are subject to DEFRA emission factors to obtain emissions from the disposal of waste generated at the end of the infrastructure’s useful life. |
| 15 | Investments | It accounts for Scope 1 and Scope 2 GHG emissions related to investments in highways over which Ferrovial has no operational control. |
| Biogenic emissions | According to the IPCC (Intergovernmental Panel on Climate Change) and the Protocol for the Quantification of Greenhouse Gas Emissions from Waste Management Activities, CO2 from the combustion of captured and piped biogas that is burned in flares, in cogeneration processes or in boilers must be reported as zero. This is because this gas comes from the decomposition of products containing organic matter of animal or plant origin that was previously captured by living organisms and, therefore, belongs to a carbon-neutral cycle. These emissions also include the incineration of organic matter in incineration plants. |
E1 – 7: GHG REMOVALS AND GHG MITIGATION PROJECTS FINANCED THROUGH CARBON CREDITS
In the last financial year, the Company has set the goal of reaching Net Zero emissions by 2050 or earlier through the SBTi for direct emissions by reducing emissions and voluntarily offsetting those that cannot be reduced. Offsetting is carried out through neutralization and mitigation actions outside the value chain, relying on nature-based solutions.
To ensure that the offsets comply with the principles of additionality, permanence and avoidance of double counting, Ferrovial acquires carbon credits from recognized quality standards, such as the VCS Standard and Gold Standard.
| Carbon credits cancelled in reporting year | 2024 | 2025 |
|---|---|---|
| Total (tCO₂eq) | 26,842 | 29,062 |
| Share from removal projects (%)* | 6.5% | 7.5 % |
| Share from reduction projects (%) | 93.5% | 92.5 % |
| Verra VCS (%) | 86.5% | 23.2 % |
| Gold Standard (%) | 12.2% | 75.3 % |
| Other** | 1.3% | 1.5 % |
| Percentage of projects in the EU (%) | 1.3% | 1.5 % |
| Percentage of carbon credits qualifying as corresponding adjustments (%) | 0 | 0 |
*Removal projects originate from biological sinks.
** Offsetting projects carried out in Spain and recognized by the Ministry for Ecological Transition and the Demographic Challenge (MITECO in Spanish).
The carbon credits Ferrovial expects to cancel in future periods amount to 63,973 tCO2eq by 2026 based on contractual agreements. This future cancellation is a high-level estimate and may be subject to change. In this way, Ferrovial addresses climate change outside its value chain and contributes to the reduction of global CO2e emissions, complementing the current climate strategy.
The Company also carries out the Compensa project, which consists of the reforestation of burned or agricultural areas in the Community of Madrid. This project generates a double positive impact, both environmental and social, since it restores degraded land while promoting local employment. It has been developed in Torremocha del Jarama, where 7.7 hectares have been reforested with a total of 4,000 trees, which will absorb approximately 2,000 tCO2eq. The project was developed in accordance with the requirements, principles and methodologies established by MITECO for the registration of GHG removal projects.
It should be noted that the Spanish Ministry for the Ecological Transition and the Demographic Challenge has awarded Ferrovial in 2025 the highest level of recognition for its work in “Calculating”, “Reducing” and “Offsetting”.
E1 – 8: INTERNAL CARBON PRICING SYSTEM
Shadow Carbon Pricing
The Company applies a methodology to economically quantify the potential climate risk of its most relevant investments using the Shadow Carbon Pricing modality in order to factor this impact on new investments. The tool takes into account Scope 1 and Scope 2 emissions, and those Scope 3 emissions that are relevant to the project, applying variable prices per ton of carbon for different time horizons, geographies and types of carbon dioxide. The calculation process is required when evaluating new investments and involves:
- Determining current or prevailing carbon prices in different countries and sectors, taking into account both explicit (such as carbon taxes and emissions trading schemes) and implicit (such as fuel taxes) mechanisms.
- Defining of an optimal carbon price based on studies by the International Energy Agency (IEA) and the International Renewable Energy Agency (IRENA).
From this information, the shadow carbon price is calculated, resulting in different prices for each country, sector, and time period, which are then combined to obtain an average shadow carbon price for each type of project. For 2025, the average carbon price is €34 per ton of CO2*.
Ferrovial has implemented a tool through which the management responsible for each project inputs information into the tool that includes business unit, type of infrastructure, country, start date, end date and Scope 1 and Scope 2 emissions. Following a case-by-case study, emissions associated with Scope 3 emissions are included where relevant.
This tool contains algorithms and a database that calculate the project’s Shadow Carbon Price based on the information described above, on an annual basis and over the entire concession period.
More specifically, it allows for the calculation of:
- the net carbon footprint of the project (defined as the increase or decrease in emissions attributable to the project compared to the pre-existing situation or the situation that would occur if the project were not executed)
- the net annual distribution of the footprint over the time horizon considered in the investment project, and
- the applicable carbon prices, which will depend on the type of project, the activities involved and the country or geographical region of implementation.
*Since the investments analyzed with shadow carbon pricing related to future investments, no locked-in emissions have been identified for this reporting period. This price is used as decision-support information when making decisions about new investments and is not recognized in the financial statements.
-
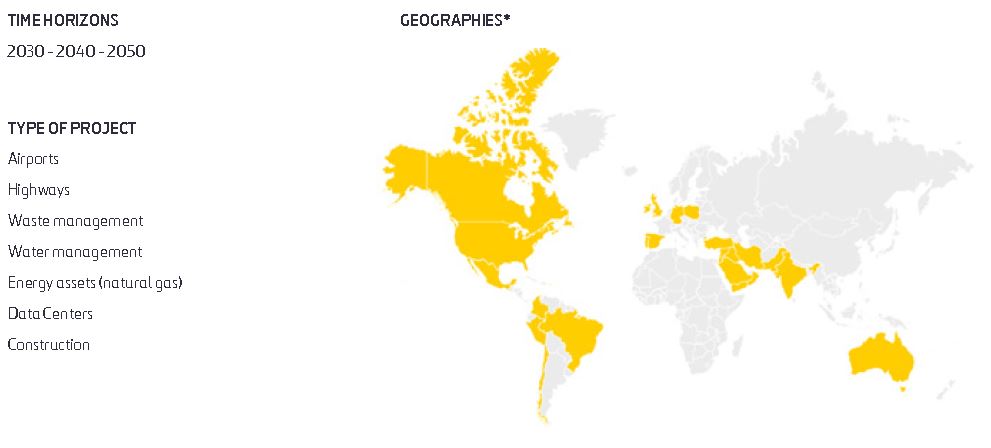
*Geographies included in the methodology: Australia, Brazil, Canada, Chile, Germany, Ireland, Mexico, Middle East, Peru, Poland, Portugal, Spain, United Kingdom, U.S., India, Colombia.