BUSINESS LINES
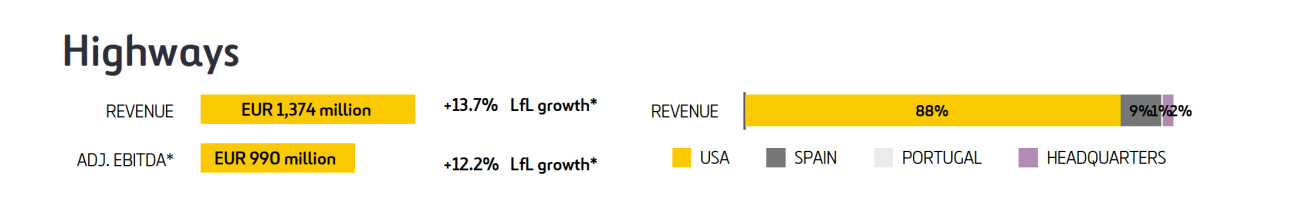
Highways
407 ETR (48.29%, EQUITY-ACCOUNTED)
407 ETR (48.29%, EQUITY-ACCOUNTED)
The financial information presented herein for the year ended December 31, 2025 is based on, and is consistent with, the audited consolidated financial statements of 407 ETR for the year ended December 31, 2025, published on February 18, 2026.
TRAFFIC
| Q4 25 | Q4 24 | VAR. | FY 25 | FY 24 | VAR. | |
|---|---|---|---|---|---|---|
| Avg trip length (km) | 23.0 | 23.0 | 0.0% | 23.3 | 23.2 | 0.3% |
| Traffic/trips (million) | 31.1 | 29.5 | 5.6% | 121.2 | 114.7 | 5.7% |
| VKTs (million) | 716.4 | 677.6 | 5.7% | 2,818.8 | 2,657.9 | 6.1% |
| Avg Revenue per trip (CAD) | 15.79 | 14.74 | 7.1% | 16.46 | 14.74 | 11.7% |
VKTs (Vehicle kilometers travelled)
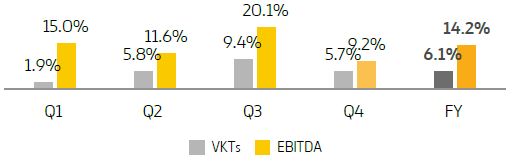
VKTs increased by +5.7% vs. Q4 2024 and +6.1% vs. 2024, due to more targeted rush hour driving offers to alleviate congestion across the GTA during workday peak hours, and an increase in mobility and rush-hour commuting from a higher percentage of on-site employees, partially offset by significant unfavorable winter weather.
Traffic (VKTs) & EBITDA performance vs. 2024:
Revenue was up by +13.5% compared to Q4 2024, reaching CAD 497 million, and +17.8% compared to 2024, reaching CAD 2,009 million.
- Toll revenue (94.2% of total in 2025): +17.6% to CAD 1,893 million, primarily due to higher toll rates effective January 1, 2025 and higher traffic volume.
- Fee revenue (5.5% of total in 2025): +15.4% to CAD 110 million, due to higher account fees resulting from higher traffic volumes and higher lease fees due to higher fee rates effective January 1, 2025, and higher enforcement fees, partially offset by the removal of tolls on Highway 407 East, which resulted in the end of service fee revenue effective June 1, 2025.
- Contract revenue (0.3% of total in 2025): driven by works related to the de-tolling of Highway 407 (CAD 6 million in 2025).
| (CAD million) | Q4 25 | Q4 24 | VAR. | FY 25 | FY 24 | VAR. |
|---|---|---|---|---|---|---|
| Toll Revenue | 464 | 413 | 12.5% | 1,893 | 1,610 | 17.6% |
| Fee Revenue | 27 | 25 | 6.6% | 110 | 95 | 15.4% |
| Contract Revenue | 6 | 0 | n.a. | 6 | 0 | n.a |
| Total Revenue | 497 | 438 | 13.5% | 2,009 | 1,705 | 17.8% |
Avg. revenue per trip was up by +7.1% vs. Q4 2024 and +11.7% vs. 2024. Q4 2025 was affected by seasonality and a softer contribution from heavy vehicles.
OPEX increased by +36.7% vs Q4 2024, and +41.3% vs. 2024, primarily due to Schedule 22 Payment expense, which amounted to CAD 40.9 million in 2025. Additionally, expenses rose due to higher provision for lifetime expected credit loss for certain historical delinquent accounts, higher billing and collection costs consistent with higher revenues and higher billing volumes. 407 ETR continues to employ routine collection activities on all 407 ETR customers’ accounts as their balances become overdue.
Higher system operations costs as result of fewer projects with salary capitalization as the 407 ETR’s enterprise resource planning and customer relationship management project went live in 2024.
Furthermore, the highway operations costs were higher in 2025 due to higher winter maintenance costs as a result of unfavorable weather conditions and higher enforcement costs.
EBITDA was +9.2% vs. Q4 2024 and +14.2% vs. 2024, due to higher revenues partially offset by the Schedule 22 Payment expense not incurred in 2024, and higher provision for lifetime expected credit loss.
407 ETR Dividends
| Q4 25 | Q4 24 | VAR. | FY 25 | FY 24 | VAR. | |
|---|---|---|---|---|---|---|
| CAD million (100%) | 1,050 | 700 | 50.0% | 1,500 | 1,100 | 36.4% |
| EUR million (% FER) | 320 | 204 | 56.9% | 452 | 321 | 41.0% |
Net debt: CAD 10,510 million (average cost of 4.33%) in December 2025 vs. CAD 9,901 million in December 2024. 59% of debt matures beyond 2039. Upcoming debt maturity dates include CAD 397 million in 2026, CAD 378 million in 2027 and CAD 379 million in 2028.
407 ETR DEBT MATURITY PROFILE (CAD MILLION)
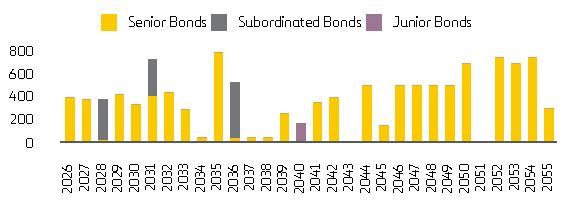
- On March 5, 2025, 407 ETR issued CAD 350 million Senior Bonds, Series 25-A1 to repay Senior Bonds, Series 20-A2 on May 22, 2025.
- On October 3, 2025, 407 ETR issued two Senior Bonds: CAD 300 million Senior Bonds, Series 25-A2 and CAD 400 million Senior Bonds, Series 25-A3.
407 ETR CREDIT RATING
| Senior Debt | Junior Debt | Subordinated Debt | Outlook | |
|---|---|---|---|---|
| S&P | A | A- | BBB | Stable |
| DBRS | A | A low | BBB | Stable |
SCHEDULE 22
The toll rate increase by 407 ETR effective February 1, 2024, terminated the Force Majeure event. 407 ETR recorded a CAD 40.9 million Schedule 22 Payment expense for 2025, which will be payable to the Province in 2026.
407 ETR TOLL RATES
407 ETR implemented a new toll rate and fee rate schedule effective on January 1, 2025. The changes also included additional toll zones and new vehicle classifications for motorcycles and medium-sized vehicles.
On January 1, 2026, a new toll rate and fee schedule came into effect.
For further details on the Company’s toll rates, please visit 407etr.com.
407 ETR SHAREHOLDER COMPOSITION UPDATE
In June 2025, Ferrovial acquired an additional 5.06% stake through the direct acquisition of 3.3% and the exercise of a call option for 1.76%, for a total investment of CAD 1.99 billion (EUR 1.3 billion)
**Non-IFRS financial measure. For the definition and reconciliation to the most comparable IFRS measure, see Alternative Performance Measures annex in the Integrated Annual Report (page 269)
DFW MANAGED LANES (USA)
NTE 1-2 (62.97%, globally consolidated)
Traffic in NTE declined by -5.5% vs. Q4 2024, and -4.7% vs. 2024, reflecting the impact of the Capacity Improvement construction works.
| (USD million) | Q4 25 | Q4 24 | VAR. | FY 25 | FY 24 | VAR. |
|---|---|---|---|---|---|---|
| Transactions (million) | 9.4 | 9.9 | -5.5% | 36.9 | 38.7 | -4.7% |
| Avg. revenue per transaction (USD) | 9.3 | 8.3 | 11.3% | 8.7 | 7.7 | 13.4% |
| Revenue | 87 | 83 | 5.4% | 323 | 299 | 8.1% |
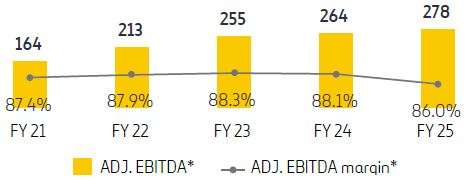
| Adjusted EBITDA* | 73 | 73 | 0.3% | 278 | 264 | 5.5% |
| Adjusted EBITDA margin* | 83.6% | 87.8% | 86.0% | 88.1% | ||
| Adjusted EBIT* | 49 | 65 | -23.9% | 229 | 233 | -1.8% |
| Adjusted EBIT margin* | 56.7% | 78.5% | 70.7% | 77.8% |
The average revenue per transaction reached USD 9.3 in Q4 2025 (+11.3% vs. Q4 2024) and USD 8.7 in 2025 (+13.4% vs. 2024), positively impacted by better traffic mix and more Mandatory Mode events1.
NTE ADJUSTED EBITDA EVOLUTION (USD million)
-
1 Mandatory Mode events occur when tolls are forced to be above the soft cap to guarantee a minimum level of service.
Adjusted EBITDA affected by the accrual of USD 4.1 million of revenue sharing for Q4 2025 (none in Q4 2024), reaching USD 8.1 million for 2025 (none in 2024).
NTE Dividends
| H2 25 | H2 24 | VAR. | FY 25 | FY 24 | VAR. | |
|---|---|---|---|---|---|---|
| USD million (100%) | 109 | 92 | 18.5% | 216 | 177 | 22.0% |
| EUR million (% FER) | 58 | 54 | 9.2% | 120 | 103 | 16.8% |
NTE net debt reached USD 1,480 million in December 2025 (USD 1,330 million in December 2024) with an average cost of 4.46%.
NTE Capacity Improvements: as a result of the success of the project, these Capacity Improvements must be implemented earlier than initially anticipated. The Capacity Improvement project started at the end of 2023 and is expected to be completed by the end of 2026. Ferrovial Construction and Webber are serving as the design-build contractor. As of December 2025, construction progress had advanced to 67%.
Credit rating
| PAB | Bonds | Outlook | |
|---|---|---|---|
| Moody’s | Baa1 | Baa1 | Stable |
| FITCH | BBB+ | BBB+ | Positive |
LBJ (54.60%, globally consolidated)
In Q4 2025, traffic declined by -4.3% vs. Q4 2024, reflecting the impact of construction works and changes in the staging of adjacent projects.
In 2025, traffic was flat (-0.1% ) compared to 2024, supported by higher mobility in the corridor despite construction-related traffic impacts in nearby corridors.
| (USD million) | Q4 25 | Q4 24 | VAR. | FY 25 | FY 24 | VAR. |
|---|---|---|---|---|---|---|
| Transactions (million) | 11.6 | 12.1 | -4.3% | 46.4 | 46.4 | -0.1% |
| Avg. revenue per transaction (USD) | 5.4 | 4.9 | 8.8% | 5.2 | 4.8 | 8.7% |
| Revenues | 63 | 60 | 4.4% | 244 | 225 | 8.6% |
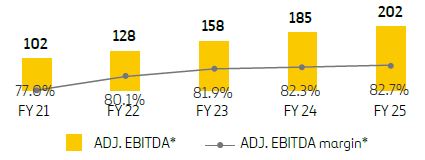
| Adjusted EBITDA* | 50 | 48 | 3.6% | 202 | 185 | 9.2% |
| Adjusted EBITDA margin* | 79.3 % | 79.9 % | 82.7% | 82.3% | ||
| Adjusted EBIT* | 37 | 39 | -6.7% | 162 | 150 | 7.7% |
| Adjusted EBIT margin* | 58.8 % | 65.8 % | 66.4% | 67.0% |
The average revenue per transaction reached USD 5.4 in Q4 2025 (+8.8% vs Q4 2024) and USD 5.2 in 2025 (+8.7% vs. 2024), positively impacted by better traffic mix.
LBJ ADJUSTED EBITDA EVOLUTION (USD million)
LBJ Dividends
| H2 25 | H2 24 | VAR. | FY 25 | FY 24 | VAR. | |
|---|---|---|---|---|---|---|
| USD million (100%) | 71 | 62 | 14.5% | 123 | 107 | 15.0% |
| EUR million (% FER) | 33 | 31 | 6.2% | 59 | 54 | 9.5% |
LBJ net debt was USD 2,036 million in December 2025 (USD 2,028 million in December 2024) with an average cost of 4.04%.
NTE 35W (53.67%, globally consolidated)
In Q4 2025, traffic was down by -0.4% vs. Q4 2024, negatively impacted by minor capture rate due to increased congestion in an entry/ exit point to the MLs, creating bottlenecks, and the finalization of capacity restrictions due to construction works on nearby road 121.
In 2025, traffic grew by +2.9% vs. 2024, driven by increased traffic in the corridor.
| (USD million) | Q4 25 | Q4 24 | VAR. | FY 25 | FY 24 | VAR. |
|---|---|---|---|---|---|---|
| Transactions (million) | 13.4 | 13.5 | -0.4% | 52.5 | 51.0 | 2.9% |
| Avg. revenue per transaction (USD) | 7.4 | 6.4 | 15.8% | 7.0 | 6.3 | 11.6% |
| Revenues | 100 | 87 | 14.7% | 368 | 320 | 14.7% |
| Adjusted EBITDA* | 76 | 71 | 7.2% | 294 | 266 | 10.6% |
| Adjusted EBITDA margin* | 76.3 % | 81.6% | 80.1% | 83.1% | ||
| Adjusted EBIT* | 58 | 63 | -7.3% | 242 | 226 | 7.3% |
| Adjusted EBIT margin* | 58.2% | 72.0% | 66.0% | 70.5% |
The average revenue per transaction reached USD 7.4 in Q4 2025 (+15.8% vs Q4 2024) and USD 7.0 in 2025 (+11.6% vs. 2024), positively impacted by better traffic mix and the increasing number of Mandatory Mode events1.
NTE 35W ADJUSTED EBITDA EVOLUTION (USD million)
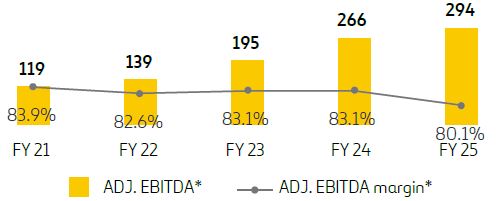
Adjusted EBITDA was affected by the accrual of USD 11.6 million of revenue sharing for Q4 2025, compared to USD 3.9 million in Q4 2024. Revenue sharing reached USD 26.4 million for 2025 (USD 14.0 million in 2024).
NTE 35W Dividends
| H2 25 | H2 24 | VAR. | FY 25 | FY 24 | VAR. | |
|---|---|---|---|---|---|---|
| USD million (100%) | 116 | 103 | 12.6% | 215 | 176 | 22.2% |
| EUR million (% FER) | 53 | 51 | 4.3% | 102 | 87 | 16.6% |
NTE 35W net debt reached USD 1,639 million in December 2025 (USD 1,637 million in December 2024) with an average cost of 5.08%.
In June 2025, NTE 35W issued USD 457 million news bonds to fully repay the TIFIA loan, with a maturity date of June 30, 2040.
NORTHERN VIRGINIA MANAGED LANES (USA)
I-66 (55.70%, GLOBALLY CONSOLIDATED)
Traffic rose by +4.3% vs. Q4 2024 and +7.4% vs. 2024, driven by increased traffic in the corridor, benefiting from greater enforcement of return-to-the office policies, despite worse weather conditions and the Federal Government shutdown (Oct-mid Nov 2025).
| (USD million) | Q4 25 | Q4 24 | VAR. | FY 25 | FY 24 | VAR. |
|---|---|---|---|---|---|---|
| Transactions (million) | 9.0 | 8.7 | 4.3 % | 34.7 | 32.3 | 7.4% |
| Avg. revenue per transaction (USD) | 8.3 | 8.2 | 1.3% | 8.4 | 7.4 | 13.3% |
| Revenues | 78 | 73 | 6.5% | 303 | 247 | 22.7% |
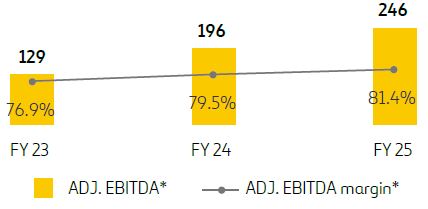
| Adjusted EBITDA* | 64 | 59 | 9.9% | 246 | 196 | 25.7% |
| Adjusted EBITDA margin* | 83.1% | 80.5% | 81.4% | 79.5% | ||
| Adjusted EBIT* | 33 | 32 | 0.2% | 151 | 116 | 30.5% |
| Adjusted EBIT margin* | 41.9% | 44.5% | 49.9% | 46.9% |
The average revenue per transaction reached USD 8.3 in Q4 2025, +1.3% vs. Q4 2024, negatively influenced by traffic mix and lower volume during peak hours, mainly due to adverse weather conditions and the temporary shutdown.
Revenue per transaction in 2025 reached USD 8.4 (+13.3% vs.2024), improved by higher toll rates, partially offset by the negative impact of the shutdown affecting traffic during peak hours.
I-66 Dividends
| H2 25 | H2 24 | VAR. | FY 25 | FY 24 | VAR. | |
|---|---|---|---|---|---|---|
| USD million (100%) | 101 | 172 | -41.3% | 165 | 172 | -4.1% |
| EUR million (% FER) | 56 | 89 | -36.7% | 89 | 89 | -% |
In December 2024, I-66 distributed its first dividend after two years of operation.
I-66 net debt reached USD 1,748 million in December 2025 (USD 1,730 million in December 2024) with an average cost of 3.58%.
| PAB | TIFIA | Outlook | |
|---|---|---|---|
| Moody’s | Baa3 | Baa3 | Positive |
| FITCH | BBB | BBB | Positive |
NORTH CAROLINA MANAGED LANES (USA)
I-77 (72.24%, GLOBALLY CONSOLIDATED)
Traffic decreased by -11.1% vs. Q4 2024 and -2.0% vs. 2024, since Q4 2024 volumes included exceptional uplift caused by hurricane Helene related alternative lane closures, compounded by adverse weather impact throughout 2025.
Credit rating
| (USD million) | Q4 25 | Q4 24 | VAR. | FY 25 | FY 24 | VAR. |
|---|---|---|---|---|---|---|
| Transactions (million) | 10.6 | 11.9 | -11.1% | 42.0 | 42.9 | -2.0% |
| Avg. revenue per transaction (USD) | 3.1 | 2.5 | 26.0% | 3.1 | 2.4 | 24.7% |
| Revenues | 33 | 30 | 11.8% | 130 | 107 | 21.9% |
| Adjusted EBITDA* | 21 | 20 | 4.8% | 81 | 69 | 16.5% |
| Adjusted EBITDA margin* | 61.8% | 65.9% | 62.2% | 65.1% | ||
| Adjusted EBIT* | 19 | 19 | 1.8% | 70 | 59 | 19.3% |
| Adjusted EBIT margin* | 58.2% | 63.9% | 54.1% | 55.3% |
The average revenue per transaction reached USD 3.1 in Q4 2025, +26.0% compared to Q4 2024 and USD 3.1 in 2025 (+24.7% vs. 2024), positively impacted by higher toll rates.
I-77 ADJUSTED EBITDA EVOLUTION (USD MILLION)
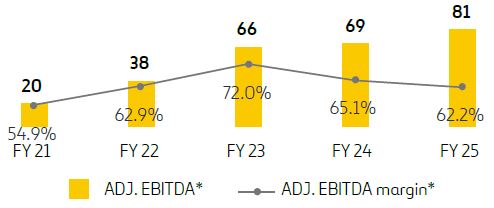
Adjusted EBITDA was affected by the accrual of USD 5.4 million in revenue sharing for Q4 2025, including the revenue share from extended vehicles, compared to USD 3.1 million in Q4 2024.
In 2025, revenue sharing including extended vehicles sharing totaled USD 21.0 million (USD 9.9 million in 2024).
I-77 Dividends
| H2 25 | H2 24 | VAR. | FY 25 | FY 24 | VAR. | |
|---|---|---|---|---|---|---|
| USD million (100%) | 30 | 39 | -23.1% | 52 | 307 | -83.1% |
| EUR million (% FER) | 18 | 26 | -29.3% | 33 | 205 | -84.0% |
In June 2024, I-77 distributed its first dividend after five years of operation.
I-77 net debt was USD 465 million in December 2025 (USD 466 million in December 2024) with an average cost of 6.24%.
CREDIT RATING
| PAB | USPP NOTES | Outlook | |
|---|---|---|---|
| FITCH | BBB+ | BBB+ | Stable |
| DBRS | BBB | BBB | Stable |

IRB (INDIA)
Based on Indian legislation, the latest available information corresponds to the closing of IRB’s third quarter of Fiscal Year 2026 (April 2025 to March 2026), which goes from April 2025 to December 2025. For comparison purposes, Ferrovial’s consolidated financial statements include IRB’s contribution for the twelve months (January to December 2025).
IRB Infrastructure Developers (IRB) (19.86%, equity-accounted)
As of December 2025, IRB Group’s project portfolio (including Private and Public InvIT) has 27 road projects that include 18 Build, Operate and Transfer (BOT), 5 Toll-Operate-Transfer (TOT), and 4 Hybrid Annuity Model (HAM) projects.
| (EUR million) | H2 25 | H2 24 | VAR. | FY 25 | FY 24 | VAR. |
|---|---|---|---|---|---|---|
| Revenue | 314 | 400 | -21.5% | 716 | 894 | -19.9% |
| Adjusted EBITDA* | 148 | 194 | -23.6 % | 313 | 449 | -30.3% |
| Adjusted EBITDA margin* | 47.2% | 48.5% | 43.7% | 50.2% | ||
| Adjusted EBIT* | 93 | 139 | -33.0% | 200 | 336 | -40.3% |
| Adjusted EBIT margin* | 29.7% | 34.8% | 28.0% | 37.5% |
Revenue drop mainly due to decrease in construction following the completion of VM1/Gandeva Ena, Palsit Dankuni and near-completion of Ganga, and by the extraordinary positive impact of Yedeshi Aurangabad claim in 2024.
In February 2026, IRB completed the sale of Gandeva Ena (VM7 Expressway Private Limited) HAM asset to the IRB InvIT Fund. IRB received Rs. 513 crore as 100% equity consideration.
IRB INFRASTRUCTURE TRUST (23.99%, EQUITY-ACCOUNTED)**
IRB Infrastructure Trust (“Private InvIT”) manages a portfolio of 12 highways in operation plus 1 under construction across India.
| (EUR million) | H2 25 | H2 24 | VAR. | FY 25 | FY 24 | VAR. |
|---|---|---|---|---|---|---|
| Revenue | 271 | 243 | 11.2% | 653 | 243 | 168.1% |
| Adjusted EBITDA* | 131 | 114 | 14.9 % | 283 | 114 | 148.6% |
| Adjusted EBITDA margin* | 48.3% | 46.7% | 43.3% | 46.7% | ||
| Adjusted EBIT* | 104 | 73 | 42.6% | 211 | 73 | 188.3% |
| Adjusted EBIT margin* | 38.5% | 30.0% | 32.3% | 30.0% |
In November 2025, IRB Infrastructure Trust unlocked capital of Rs. 4,900 crores through the sale and transfer of its 100% stake in Hapur Moradabad Tollway Limited, Kaithal Tollway Limited and Kishangarh Gulabpura Tollway Limited to the IRB InvIT Fund.
In December 2025, IRB Infrastructure Trust incorporated the TOT- 17 project in the state of Uttar Pradesh and paid an upfront bid concession fee of Rs. 9,270 crores for a period of 20 years.
In February 2026, IRB Infrastructure Trust incorporated the TOT-18 project in the state of Orissa and will pay an upfront bid concession fee of Rs. 3,087 crores for a period of 20 years.
*Non-IFRS financial measure. For the definition and reconciliation to the most comparable IFRS measure, see Alternative Performance Measures in the Integrated Annual Report (page 269)
**IRB Infra.Trust: 2024 figures reflect only six months of activity following the acquisition.
ASSETS UNDER DEVELOPMENT
ASSETS UNDER DEVELOPMENT
| (EUR million) | INVESTED CAPITAL |
PENDING COMMITTED CAPITAL |
NET DEBT 100% |
CINTRA SHARE |
|---|---|---|---|---|
| Equity Consolidated | 739 | 155 | 1,614 | |
| Anillo Vial Periférico | 29 | 140 | 0 | 35.0 % |
| IRB Private InvIT | 710 | 15 | 1,614 | 24.0 % |
- Anillo Vial Periférico (Lima, Peru): a Cintra led-consortium, signed the concession contract to develop the Anillo Vial Periférico (Peripheral Ring Road) in Lima under a concession format with an investment of USD 3.4 billion in November 2024. This amount includes contributions from public funds by the Public Administration. Ferrovial, through Cintra, owns 35% of the consortium. This project comprises the design, financing, construction, management and maintenance of a 34.8 km urban highway.
- IRB Private InvIT (India): On December 27, 2024, IRB Private InvIT acquired 80.4% of the Ganga Expressway. When IRB Private InvIT acquires the remaining 19.6% of the Ganga Expressway, Ferrovial’s investment in IRB Private InvIT is expected to increase by EUR 15 million.
TENDERS PENDING
TENDERS PENDING
Ferrovial remains focused on the U.S. as its key market, and continues to closely monitor private initiatives:
- In February 2025, a Cintra-led consortium was shortlisted for bidding on the I-285 East Express Lanes in Atlanta (Georgia). The project consists of the implementation of Managed Lanes along 30 miles of the highly congested ring road; bid submission is anticipated during H2 2026. Additionally, the Georgia DOT expects to issue the request for qualification (RFQ) for the I-285 West Express Lanes before the end of 2026, the project will cover 11 miles.
- Additionally, a Cintra-led consortium was shortlisted for bidding on the I-24 Southeast Choice Lanes project in Tennessee; bid submission is anticipated during H1 2026. The project will span 25 miles (Phase One: 20 miles and Phase Two: 5 miles), covering the area between I-40 in Nashville and I-840 in Murfreesboro.
- In February 2026, Ferrovial-led consortium was shortlisted for
bidding on the I-77 South Express Lanes project. The project will
add 11 miles of Managed Lanes; bid submission is anticipated during
H1 2027. - Ferrovial continues to analyze other opportunities that could be located in other U.S. states.
In addition to these opportunities in the U.S., Cintra is active in other geographies where selective investments could be pursued. As an example, Cintra was shortlisted for the bidding of D35 Highway project (Czech Republic) in December 2024, which follows an availability payment concession model; bid submission is expected during H1 2026. The project involves the total reconstruction of an existing 35 km section of D35, as well as the operation and maintenance of this section and an adjacent 17 km section reconstructed by third parties.